Bull Flag vs Bear Flag: Chart Patterns Every Trader Should Know
Bull Flag: A pattern that forms after a sharp price rally, followed by brief consolidation — usually signals continuation upward.
- Bear Flag: The mirror image — appears after a sharp decline, followed by a small upward pullback, typically signaling further downside.
- Flags help traders time entries with tight risk levels, but false breakouts are common in volatile markets like crypto.
What Is a Bull Flag?
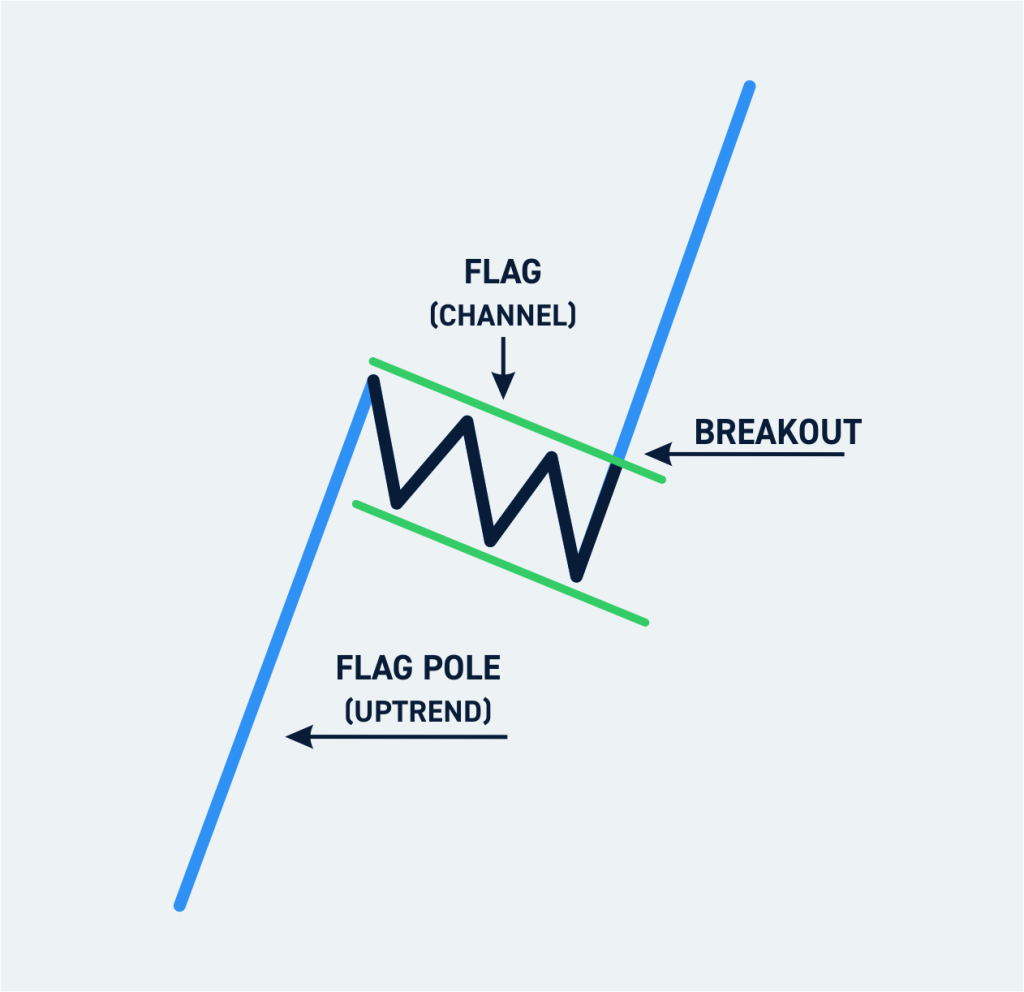
A bull flag forms when price surges upward (the “flagpole”), then consolidates slightly downward or sideways inside a small, parallel channel (the “flag”). This indicates that buyers are taking a breather before another potential rally.
Typical structure:
- Strong upward move with high volume — the flagpole.
- Small pullback or sideways consolidation with decreasing volume — the flag.
- Breakout above resistance — continuation of the uptrend.
In crypto, bull flags often appear during early stages of parabolic runs — for instance, when Bitcoin breaks resistance and consolidates for a few hours before another push higher. Traders see this as a healthy pause, not a top.
Example of a Bull Flag
Imagine BTC rallies from $40,000 to $44,000, then trades sideways between $43,500 and $42,800 for several candles. Volume drops, but price stays above the 50-EMA. A breakout above $44,000 confirms the pattern and targets around $48,000 (roughly the height of the flagpole added to the breakout point).
What Is a Bear Flag?
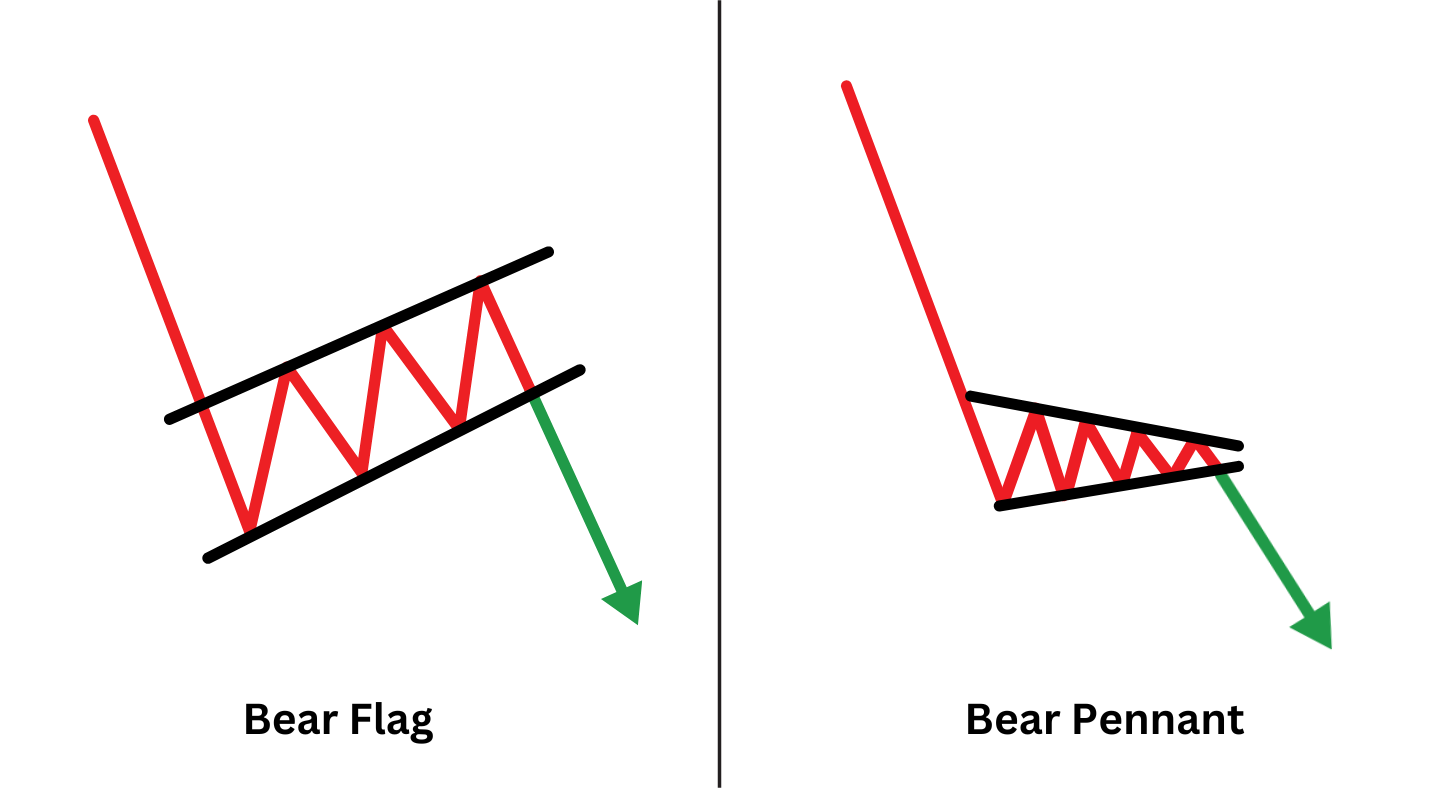
A bear flag occurs after a sharp price drop (the flagpole) followed by a modest rebound that forms an ascending channel or rectangle (the flag). The rebound shows weak buying, and once sellers regain control, the trend usually continues downward.
Typical structure:
- Strong downward move on heavy volume — the flagpole.
- Shallow upward consolidation or range — the flag.
- Breakdown below support — continuation of the downtrend.
Example of a Bear Flag
ETH crashes from $3,000 to $2,700, then bounces back to $2,850 in a tight channel. Volume decreases as price climbs. Once it breaks below $2,700 again, it completes the bear flag — targeting around $2,400 based on the height of the flagpole.
Key Differences Between Bull and Bear Flags
| Feature | Bull Flag | Bear Flag |
|---|---|---|
| Trend Direction | Uptrend continuation | Downtrend continuation |
| Flag Shape | Small downward or sideways channel | Small upward or sideways channel |
| Volume Pattern | Volume drops during flag formation, rises at breakout | Volume drops during pullback, spikes at breakdown |
| Breakout Trigger | Close above resistance | Close below support |
| Target Projection | Flagpole height added to breakout point | Flagpole height subtracted from breakdown point |
How to Trade Flag Patterns
1. Identify the Flagpole
Look for a strong impulsive move in one direction — ideally supported by high volume. This forms the flagpole and defines your bias (bullish or bearish).
2. Confirm the Flag
After the surge, price usually consolidates in a small channel. Confirm the pattern by spotting parallel trendlines and decreasing volume.
3. Wait for Breakout or Breakdown
Enter when price breaks out of the flag with volume confirmation. Avoid entering too early — false breakouts are common, especially in volatile assets like altcoins.
4. Set Targets and Stop-Loss
- Target: Measure the height of the flagpole and project it from the breakout point.
- Stop-loss: Below the lower trendline (for bull flags) or above the upper trendline (for bear flags).
5. Manage Risk
Flags can fail — especially near major support or resistance. Always manage position size and use trailing stops if the move extends further than expected.
Common Mistakes to Avoid
- Entering before confirmation — always wait for breakout or breakdown with volume.
- Ignoring broader market context — patterns work best when aligned with higher timeframe trends.
- Setting unrealistic targets — use measured moves, not arbitrary multiples.
- Forgetting risk management — flags fail frequently in sideways markets.
Using Flags in Crypto Trading
In crypto, where volatility is extreme, flag patterns can appear even on small timeframes (like 15-minute charts). Scalpers often use them for short bursts of momentum. However, long-term traders may combine them with moving averages or RSI divergence for confirmation.
Bitcoin, Ethereum, and Solana frequently form bull flags after large rallies, while bear flags often appear during sharp corrections or post-news sell-offs. Monitoring these formations can help identify entry and exit points for both spot and futures trading.
Combining Flags with Other Indicators
- Moving Averages (MA): Flags that hold above the 20 or 50 EMA have higher success rates.
- Volume Analysis: Rising volume on breakout confirms strength.
- RSI/MACD: Momentum indicators can confirm or contradict flag setups.
FAQ
- Are flag patterns reliable?
Yes, but only when combined with volume and broader trend confirmation. False signals are common in low-liquidity markets. - How long do flags last?
Typically from a few hours to several days, depending on timeframe and volatility. - Do bull flags always break up?
No. Sometimes they become rectangles or reverse into triangles — flexibility is key. - Which timeframe works best?
4H and 1D charts show the most reliable flags, but patterns also form intraday. - Can you use flags in crypto futures?
Absolutely. Many traders use bull/bear flags to plan leverage entries with defined risk.
Conclusion
Bull and bear flags are classic continuation patterns that help traders spot pauses in momentum before the next move. A well-timed flag trade offers clear entries, manageable risk, and high reward potential — especially when combined with proper volume analysis and broader trend alignment.
In 2025’s fast-moving crypto market, pattern recognition is an edge — learn to identify flags early, confirm with data, and execute with discipline.
Disclaimer: This content is for educational purposes only and does not constitute financial advice. Always perform your own research before trading.

Private crypto swaps
Best rates. Secure. Wallet to wallet