TL;DR: A doji candle is a candlestick pattern that forms when an asset’s opening price and closing price are nearly the same. This pattern indicates a possible balance between buyers and sellers. Used alone, it simply suggests market indecision, but combined with other indicators, a doji can spotlight potential reversals or trend pauses. Whether you are a crypto novice or just new to technical charts, understanding doji candles can sharpen your decision-making.
Understanding doji candles

A doji candle is a candlestick formation where the open and close prices of a crypto asset (or any asset) are nearly identical. On a candlestick chart, you will typically see a small body line with a thin wick extending above and below, showing that the price moves up and down during the time frame but ends right around where it starts.
This pattern is classic among traders because it signals that neither the bulls (buyers) nor the bears (sellers) are in firm control. Markets usually see doji candles at possible turning points, but a doji can also appear during a sideways market. The message is consistently one of indecision.
Basic candlestick patterns
If you are fresh to technical analysis, candlestick charts show a market’s movement within a specific period. Each candlestick normally contains:
The open price
The close price
The high (the top of the wick)
The low (the bottom of the wick)
Typical candlestick formations can hint if a market is bullish (prices trending up) or bearish (prices trending down). For instance, a long green candle often shows strong buying momentum, whereas a long red candle can reflect heavier selling. Recognizing these formations helps you see possible market shifts earlier, giving you time to plan or adjust your trades.
Why doji patterns stand out
A doji candle’s main characteristic is its tiny body. This shape forms because the open and close are very close to each other, meaning the market tried to move in one direction, reversed, and then ended up back near the starting point.
In simpler terms, seeing a doji candle can signal that you should pause and pay extra attention. When buyers and sellers reach a short-term balance, any new spark of momentum can tip the price path in one direction or the other. This is why doji candles are often found at or near pivot points where a trend might stall or reverse.
Types of doji candles
Not all doji candles look the same. Over time, traders and analysts have taught themselves to read multiple doji styles depending on the wick lengths and the positioning of the open and close prices. Understanding these variations can help you interpret the specific mood of the market.
Common doji variations
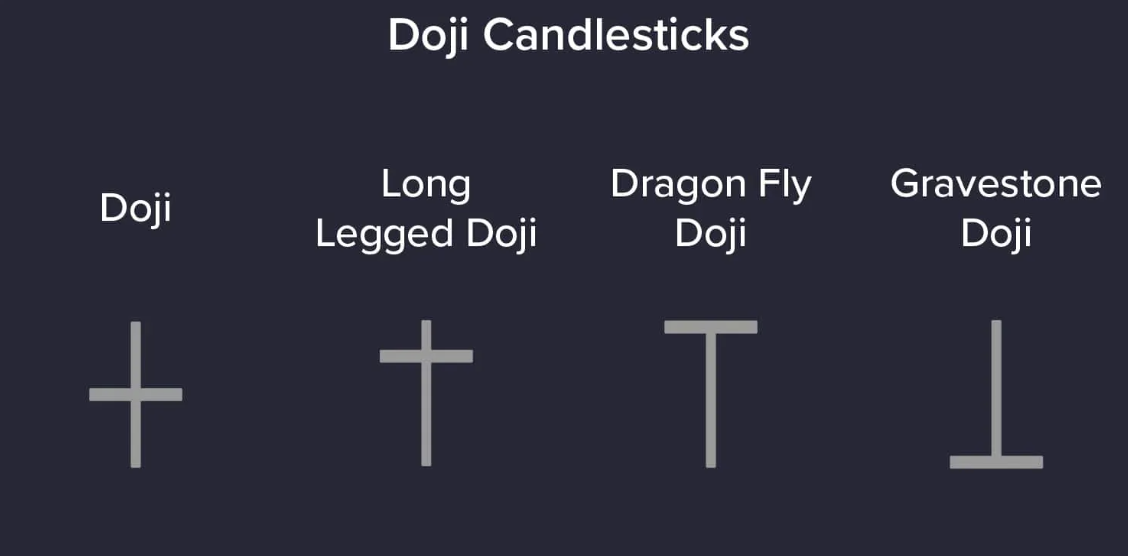
Long-legged doji
Characterized by wicks that are roughly equal in length on both ends. The long wicks reflect substantial back-and-forth between bullish and bearish pressure.
Gravestone doji
This doji has a long upper wick and a very small or nonexistent lower wick. It often suggests that bulls pushed prices higher but eventually lost control, bringing the close back down.
Dragonfly doji
Opposite of a gravestone doji, this pattern displays a long lower wick with minimal or zero upper wick. Bears drove the price lower in the trading session, yet the market rebounded toward the opening price.
Four price doji
This formation shows virtually no wick on either side. While rare, it signifies that during that period, the market hardly budged. Buyers and sellers stayed stuck, producing a flat line.
These doji shapes vary, but they share a unifying theme: indecision. The difference lies in whether that indecision leans bullish (dragonfly doji) or bearish (gravestone doji), or if it is purely balanced (long-legged doji).
Spotting indications
When you see one of these doji variations on your chart, consider how it fits into the bigger picture. Are you looking at a market that has been climbing for a week and suddenly shows a gravestone doji? That might signal an upcoming pullback. Or if the market has been sliding down for days and a dragonfly doji appears, it might be hinting at a bottom or a slowing descent.
At the same time, doji candles on their own do not guarantee reversals. They simply highlight a potential shift that needs confirmation. Combining them with other tools, such as volume analysis or momentum indicators, helps you decide how to respond.
Why doji candles matter in crypto
Crypto markets can be famously volatile, rising and falling in short bursts that experienced traders capitalize on. Because of this heightened pace, every clue about market direction, including the presence of a doji candle, can be valuable.
Sentiment and market psychology
Doji candles are reflections of how participants feel about a coin’s future prospects. Bitcoin and altcoins often experience sudden surges of attention that cause spikes or drops in price. A doji forming after a major price run could mean that interest has stabilized, turning previous buyers more cautious. If this caution shifts into selling sentiment, you might witness a price drop. Conversely, a doji followed by an immediate push upward can signal reinvigorated demand.
You can think of a doji like a traffic light that flashes yellow. It is not a surefire stop sign, but it indicates caution and the possibility of a new direction. The crypto world’s volatility magnifies the effect, so paying attention to doji candles could help you gauge the mood before jumping in.
Timing your moves
Many beginner traders get trapped by FOMO (fear of missing out) or panic-selling. By spotting a doji candle early on, you can calm your emotions and assess the situation objectively. Maybe the doji is a clue that the latest run is losing steam, so you might choose to wait and avoid buying at an inflated price. Or you might see a doji as a potential floor in a falling market, prompting you to hold off on selling too soon.
Still, you never want to rely on doji candles (or any single indicator) as a magic bullet. Instead, think of them as signposts for deeper investigation, whether you are eyeing a short-term trade or planning a longer hold.
Using doji candles in your strategy
Your basic approach to doji candles should be to watch for them at places where a trend might be ready to pause or pivot. If you keep your eyes open for these patterns, you can potentially catch better entry or exit points. Even if you do not make a move, noticing a doji can still prompt you to tighten your stop-loss or revisit your plan.
Combining doji with other indicators
Some common technical tools that amplify the usefulness of doji candles include:
Volume trends
Moving averages (like the 50-day or 200-day)
Momentum oscillators (e.g., Relative Strength Index, or RSI)
Support and resistance lines
For instance, if you see a dragonfly doji at a major support line alongside a rising RSI, the stage might be set for a reversal upward. Or if a gravestone doji appears near significant resistance and is paired with dropping volume, you might prepare for a downturn.
Real-world example
Imagine Ethereum (ETH) has trended upward for five consecutive days and has approached a known resistance level. You spot a gravestone doji on the daily chart. That doji alone could hint that buyers are struggling to move the needle further. As a result, you might watch the following day’s action more carefully. If the price falls below that doji’s low, it could confirm a downward correction.
On the flip side, if ETH breaks above the candlestick high, it may mean the bulls are still in control. In both cases, the doji is your early signal to pay attention.
Where xgram fits in
You might also be looking for easy ways to put your technical analysis insights into action. That is where platforms like xgram come in. First, xgram helps you carry out both cross-chain and standard swaps quickly, so you can pivot your position on different coins without juggling multiple services. Second, you can often save on network fees because xgram streamlines the swapping process. Third, you do not need to connect a wallet or worry about complicated signups, making it more beginner-friendly compared to advanced exchanges. Fourth, the user interface prioritizes clarity, ensuring you do not lose your way mid-swap. Lastly, you can execute your trades right when the doji candles and other signals prompt you, letting you probe potential crypto opportunities with more agility.
Common pitfalls and best practices
Doji candles can add clarity to your trading decisions, but they do not guarantee a specific outcome. Markets are influenced by thousands of variables, from macroeconomic policy to social media hype. Overemphasizing a doji candle can tug you into hasty moves with little rationale to back them.
Overreliance on single signals
Relying purely on one candlestick pattern, be it a doji or anything else, is a trap. Doji candles merely warn you that the market is in a tug-of-war. While this moment of hesitation may precede a burst in either direction, you will usually need other data to get a stronger sense of which side might win out. Fundamentals, market news, and volume spikes can all tip the scales.
Patience and risk management
Part of confident trading is knowing how to pace yourself. After seeing a doji candle, you might decide to wait until the next session to confirm a direction. Let the market reveal more evidence. Also, avoid placing overly aggressive bets. Use stop-loss orders, especially in crypto’s fast-moving environment, and diversify your holdings to cap your overall risk.
Keep learning
Market patterns evolve over time, and new projects or protocols appear almost daily in the crypto world. The doji candle is a valuable piece of the puzzle, but there is always more to explore. Keep reading, experiment with demo accounts (if possible), and talk to more experienced traders. You will quickly notice that your knowledge multiplies when you engage with a community of enthusiasts.
Frequently asked questions
What makes a doji candle different from other candlestick patterns?
A doji stands out because its open and close prices fall extremely close to each other, sometimes almost identical. This forms a small or nearly invisible body, and it signals that buyers and sellers reached a momentary equilibrium. Other candle patterns often show more decisive buying or selling pressure.Why do doji candles sometimes fail to predict a reversal?
Doji candles alone are not certain signs of reversal. They really just show indecision. In a bullish trend, a brief interruption can happen before the price continues to climb. That means a doji might not lead to any trend change. Confirming signals or combining the doji with other indicators can offer better insights.Do different types of doji candles matter?
Yes. A gravestone doji hints that purchasers tried to drive prices higher but ran out of steam, while a dragonfly doji suggests that sellers were active before being forced back up. Long-legged and four price dojis are less common, but each variation highlights slightly different forms of indecision.Should I buy or sell immediately after spotting a doji candle?
Not necessarily. A doji signals uncertainty, which can mean a turning point or just a temporary pause. It is wise to wait for additional signs. Look at volume changes, track other technical tools, or watch price action in the next candle. Let the market confirm what it might do next before jumping in.Can I use a doji candle strategy in other markets besides crypto?
Absolutely. Doji candles appear in the stock market, commodities, forex, and more. The principle of indecision is universal, so you can apply doji-based techniques in any chart-based trading environment. Still, remember that each market has its own quirks. Crypto, for example, typically moves faster and may respond more dramatically to news and social media buzz.
Conclusion
A doji candle is a useful clue when you are reading price charts and planning your next move in the crypto space. By showing short-lived indecision between buyers and sellers, a doji can act as an early signal that a major shift—either up or down—may be brewing. However, jumping to conclusions without more evidence can be risky. Pair your doji observations with volume data, moving averages, support lines, and even social trends to gain a more rounded perspective. Keep in mind that mistakes and successes both contribute to your learning curve. With consistent attention, patience, and a focus on risk management, you can use doji candles to navigate new market opportunities with greater confidence.