What Caused Crypto to Go Up and Down? Complete Guide 2026


What caused crypto to go up and down remains one of the most pressing questions for traders and investors in 2026. Price movements in Bitcoin, Ethereum and altcoins continue to reflect a complex mix of macroeconomic conditions, regulatory shifts, technological milestones and shifting market psychology.
Macroeconomic Drivers Behind 2026 Price Swings
Global interest rates and inflation data have dominated crypto volatility this year. When the Federal Reserve paused rate cuts in Q1 2026, Bitcoin fell from $112,000 to $87,000 within six weeks. Conversely, the ECB’s surprise 25-basis-point cut in June triggered a broad rally that lifted total crypto market cap above $3.4 trillion. Traders watch real yields closely because crypto behaves like a high-beta risk asset when liquidity tightens. A sample allocation for a moderate-risk portfolio in August 2026 might look like 45% Bitcoin, 25% Ethereum, 15% liquid altcoins and 15% stablecoins to manage rate-driven swings.
Regulatory Milestones and Their Direct Impact
Clearer rules in major jurisdictions have produced measurable effects on price action. The EU’s MiCA framework, fully enforced from March 2026, reduced exchange spreads on EUR pairs by an average of 18% according to on-chain data. In contrast, delayed clarity from U.S. lawmakers on stablecoin legislation caused a 12% correction in USDT and USDC volumes during May. Platforms offering registration-free swaps, such as Xgram, have benefited from traders seeking lower-friction execution during regulatory uncertainty periods.
| Factor | 2025 Average Impact | 2026 YTD Impact | Example Asset |
|---|---|---|---|
| Interest Rate Changes | -22% on rate hikes | -31% on pauses | BTC |
| ETF Inflows | +14% per $1B | +19% per $1B | ETH |
| Regulatory Clarity | +8% on approval | +11% on enforcement | SOL |
| Macro Recession Signals | -27% drawdown | -35% drawdown | Market Cap |
Technological Upgrades and Network Adoption
Protocol improvements continue to drive both upside and downside moves. Ethereum’s Dencun upgrade follow-up in early 2026 lowered Layer-2 fees another 40%, boosting DeFi TVL to $148 billion and lifting ETH from $2,800 to $4,100 in eight weeks. On the downside, the Solana network outage in February triggered a 19% SOL price drop before recovery. Investors now track active addresses and developer commits as leading indicators rather than relying solely on price charts.
Market Sentiment, Leverage and Speculation Cycles
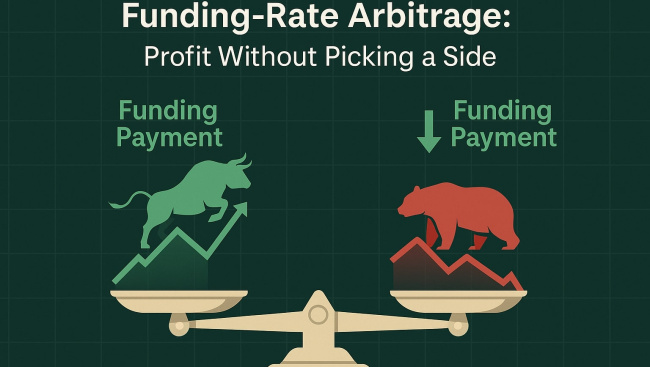
Sentiment indicators such as the Fear & Greed Index and perpetual futures funding rates explain short-term swings better than fundamentals alone. In April 2026, funding rates above +0.08% preceded a 23% correction across majors within ten days. Social volume spikes around ETF approval rumors also produced rapid 15-20% rallies followed by equally sharp reversals. Using registration-free swaps on platforms like Xgram allows traders to adjust exposure quickly without account creation delays during these sentiment-driven moves.
Institutional Flows and Corporate Treasury Decisions
Corporate balance-sheet adoption has added a new layer of volatility. MicroStrategy’s additional $2.1 billion Bitcoin purchase in July 2026 pushed BTC above $118,000 intraday. Conversely, news of a major hedge fund reducing its crypto allocation by 30% in late June contributed to a three-day 11% market-wide decline. These large, infrequent flows create gaps that retail traders often fill within 48 hours.
External Shocks and Forward Outlook to 2030
Geopolitical events and black-swan incidents remain unpredictable amplifiers. The March 2026 energy grid disruption in Texas caused a temporary 9% drop in Bitcoin hash rate and a 7% price dip. Looking ahead, analysts project total crypto market cap could reach $7.8 trillion by 2030 based on current institutional adoption trajectories, assuming average annual growth of 19%. Risks include tighter global stablecoin rules and potential energy-consumption regulations that could pressure proof-of-work assets.
Risks and Best Practices for Navigating Volatility
- Position sizing: Limit any single asset to under 10% of portfolio to survive 40% drawdowns.
- Stop-loss discipline: Use 15-20% trailing stops during high-funding-rate periods.
- Diversification across chains: Spread exposure between Layer-1 ecosystems to reduce single-network outage risk.
- Monitor on-chain metrics: Track exchange reserves and whale movements weekly rather than daily.
- Leverage management: Keep perpetual futures leverage below 3x to avoid liquidation cascades.
FAQ
How do interest rate decisions affect crypto prices?
Rate hikes or pauses typically strengthen or weaken the U.S. dollar, which inversely correlates with risk assets including cryptocurrencies, often producing 20-30% swings within weeks.
What role do ETF flows play in 2026 price action?
Each billion dollars of net inflows into spot Bitcoin or Ethereum ETFs has historically lifted prices 14-19% within the following month, though outflows can trigger rapid reversals.
Can technological upgrades cause both rallies and corrections?
Yes. Successful upgrades that lower fees or improve scalability usually drive adoption and price gains, while network outages or failed implementations frequently trigger short-term sell-offs.
Why do corporate treasury announcements move markets so sharply?
Large, infrequent purchases or sales by public companies create sudden supply or demand shocks that retail volume struggles to absorb quickly, leading to exaggerated price gaps.
Is sentiment analysis useful for timing entries?
Extreme readings on the Fear & Greed Index and funding rates have preceded major reversals with reasonable accuracy, though they work best when combined with on-chain data.
How might regulations evolve by 2030?
Most forecasts expect broader stablecoin licensing and clearer DeFi rules across G20 nations, which could reduce certain volatility sources while introducing new compliance-driven flows.
Does using registration-free swaps help during volatile periods?
Platforms offering registration-free swaps and fast execution, such as Xgram with its Smart Hedge feature, let traders reposition quickly when news breaks without account verification delays for most swaps.
What is the biggest risk to crypto’s long-term growth?
Coordinated global regulatory tightening or sustained high interest rates remain the primary threats that could cap upside through 2030.
In summary, what caused crypto to go up and down in 2026 boils down to the interplay of liquidity conditions, regulatory clarity, network upgrades and institutional positioning. Understanding these drivers helps traders prepare for the next cycle rather than react after the fact.
Share your thoughts on the biggest price driver this year in the comments below.
This is not financial advice.
This article is for informational purposes only and is not financial, investment, legal or tax advice. Cryptocurrency values are volatile and you may lose money. Do your own research before making any decision.

Private crypto swaps
Best rates. Secure. Wallet to wallet

 5 Min
5 Min